Salary Benchmarks
RevOps Salaries by Role Type
How compensation varies across revenue operations specializations.
Average Salary by Role Type
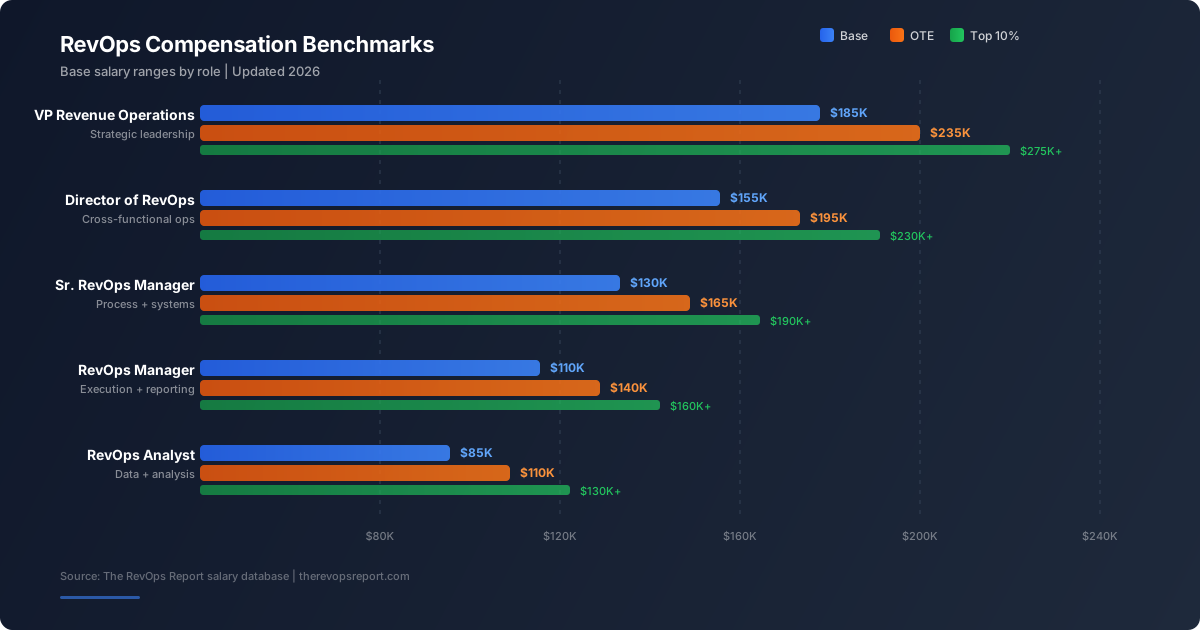
| Role Type | Average | Median | Range | Jobs |
|---|---|---|---|---|
| Deal Desk | $168K | $150K | $64K - $385K | 25 |
| RevOps | $167K | $163K | $60K - $400K | 82 |
| Enablement | $165K | $150K | $52K - $300K | 59 |
| Marketing Ops | $149K | $140K | $31K - $352K | 77 |
| Sales Ops | $140K | $129K | $45K - $299K | 90 |
| Operations | $140K | $132K | $58K - $258K | 16 |
Role premium: Deal Desk roles lead at $168K average, $28K more than Operations ($140K). Enablement and Business Ops command premiums because they typically involve broader scope and cross-functional influence.
Methodology: Data based on 349 job postings with disclosed compensation, collected from Indeed, LinkedIn, and company career pages as of August 2026. All salary figures represent posted ranges, not self-reported data.
Get Weekly RevOps Intelligence
Get weekly market data + quarterly State of RevOps reports. Free.
Free weekly email. Unsubscribe anytime.